Detecting design evolution...
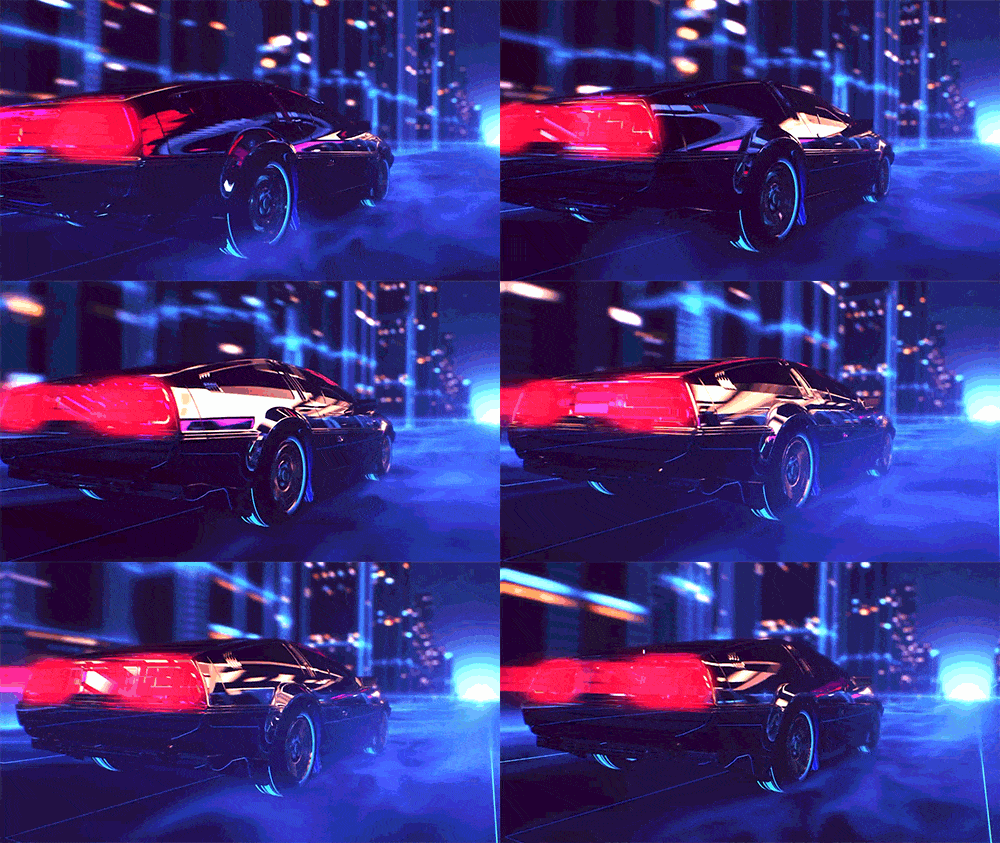
Car Design Feature Point Detection & Analysis
Introduction
This project focuses on using computer vision to analyze car design changes over the years. By detecting bounding boxes and 50 specific design keypoints on car images, I built a system to quantify and visualize the evolution of automobile designs.
Key Highlights
- 🔍 Purpose: To measure and visualize design distinctiveness between car models.
- 🛠️ Technology: PyTorch, ResNet-34, Vision Transformer, OpenCV, and Makesense.ai for annotation.
- 📊 Results: The trained model predicts bounding boxes and 50 keypoints with high accuracy.
- 🎯 Challenges: Manual annotation of images using Makesense.ai required significant time investment (30 mins per image).
Dataset
The dataset consists of 17 high-quality images of diverse car models annotated with bounding boxes and 50 keypoints. Key features include:
- Grille edges
- Headlights
- Roof Corners
- Windshield Points
- Bumper Corners
- Farthest edges
Modeling Approach
Before training the models, a preprocessing pipeline was developed to ensure data consistency and improve the model's generalization ability:
- Image Resizing: Resized all images to 1280x850 pixels.
- Data Augmentation: Applied rotations, brightness/contrast adjustments, flips, and cropping.
- Normalization: Normalized pixel values and subtracted channel-wise mean and standard deviation.
- Keypoint Label Encoding: Normalized keypoint coordinates relative to image dimensions.
A two-task deep learning pipeline combining CNNs and transformers:
- ResNet-34: Extracted spatial features for bounding box prediction.
- Output: Bounding box coordinates (
x_min,y_min,width,height). - Pretrained on ImageNet for initialization.
- Output: Bounding box coordinates (
- Vision Transformer (ViT): Extracted global features for keypoint detection.
- Output: 50 keypoints (
x,ycoordinates). - Attention mechanism to capture spatial relationships.
- Output: 50 keypoints (
Custom loss functions were used for the dual-task outputs:
- IoU Loss: For bounding box predictions.
- Mean Squared Error (MSE): For keypoint regression.
- Weighted Loss Combination:
Loss = λ1 * IoU + λ2 * MSE, whereλ1andλ2are hyperparameters tuned via grid search.
The training process was designed to ensure maximum performance:
- Optimizer: Adam optimizer with a learning rate of 0.001.
- Batch Size: 16 images per batch.
- Scheduler: Cosine annealing with warm restarts.
- Epochs: Trained for 50 epochs with early stopping.
- Cross-Validation: k-fold validation (k=5).
The following metrics were used to evaluate the model:
- Mean Average Precision (mAP): Evaluated bounding box predictions.
- Keypoint Accuracy: Percentage of keypoints predicted within a 5-pixel radius.
- Loss Curves: Monitored training and validation loss trends.
Visualizations
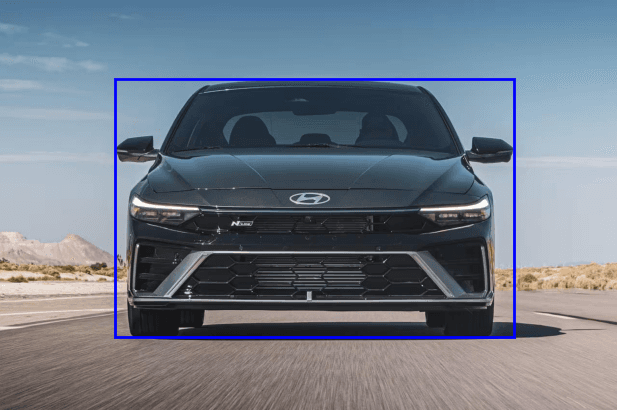
Figure 1: Bounding Box Placement Visualization
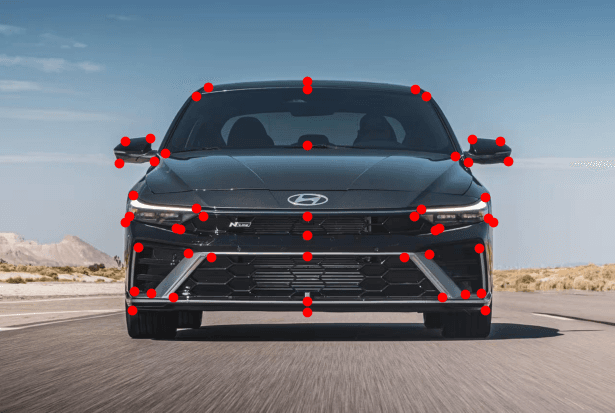
Figure 2: 50 Design Keypoints Visualization
Evolution Over Time Example
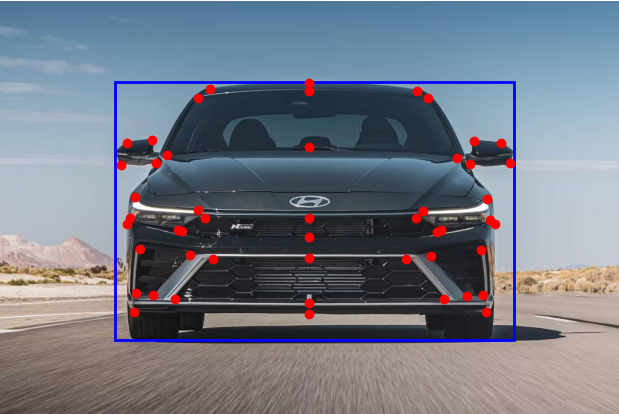
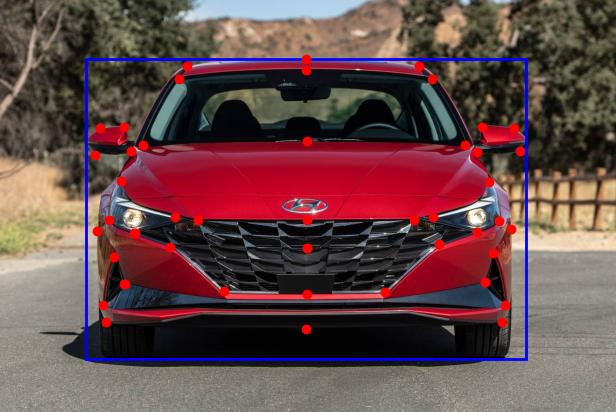
Slide to compare design evolution between models, showcasing changes in grille shape, bumper box design, and overall aesthetics.
Final Steps
To truly understand the design distinctiveness between car models, I computed the Euclidean distance between each corresponding label across images. This distance helps us capture even the smallest variations in the design.
But that's not all. I normalized all coordinates to ensure consistency. Each coordinate is scaled by the car's width and length, calculated as the differences between the extreme x and y points. This ensures fair comparisons, no matter the image dimensions.
Finally, the sum of these normalized Euclidean distances provides us with a single, meaningful metric—a comprehensive measure of the design difference between car models.
Design Difference Score Example
2.21
Difference
The design similarity score between Hyundai Elantra Model 2021 and Hyundai Elantra Model 2024 is 2.21. This indicates that while the models share somewhat insignificant design overlap, where the differences highlight subtle but impactful design evolution over time.
Future State
- Expand the dataset to include 100+ diverse car models for better generalization.
- Implement more data augmentation techniques for robustness.
- Experiment with Dask and Spark to optimize memory and computational overhead.
Additional Resources
Explore the full project, detailed codebase, and additional insights on GitHub!
Visit GitHub Repository